
What are EEG and QEEG?
THE HUMAN BRAIN | QEEG | ERPs | LORETA
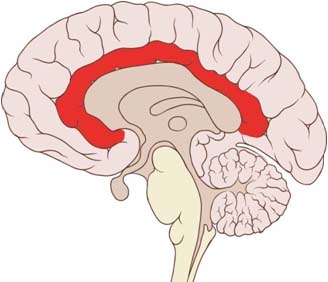
The human brain is surely the most complicated system in nature. Electroencephalography is the brain-imaging tool used to measure the brain’s bioelectrical system. It measures spontaneous brain activity and has the highest temporal resolution of all brain imaging tools. The activity of groups of neurons is represented by specific wave patterns. Optimal patterns of connectivity and networking are vital to good brain health.
QEEG (QUANTITATIVE ELECTROENCEPHALOGRAM)
Further, quantitative electroencephalogram (QEEG) compares your client’s EEG to that of a normative database. With a quantitative electroencephalogram (QEEG), event related potential recording (ERP) and/or other assessment tools; you the clinician can determine where there is pathology or deviation from the norm and use this information to design neuromodulatory treatments.
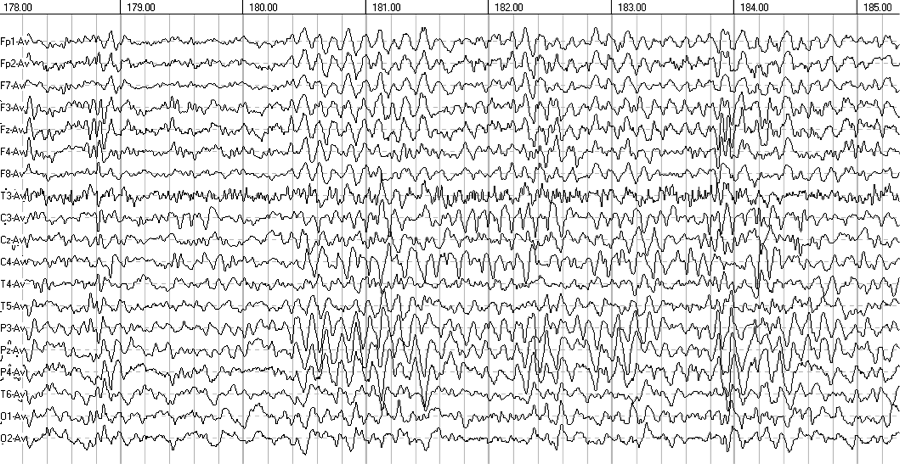
Recording the EEG is a practiced skill. The old adage, “Garbage in, garbage out” holds true to EEG acquisition. Skills to help the patient sit relaxed and keep his or her eyes motionless, whether with eyes open or closed are necessary. Additionally, certain populations, such as ADHD or autism spectrum disordered will need careful coaching to remain still for a length of time. Others may need coaching to stay awake, etc. Importantly, reading the live trace to evaluate for epileptiform activity, pre-sleep onset and/or other transient activity is essential.
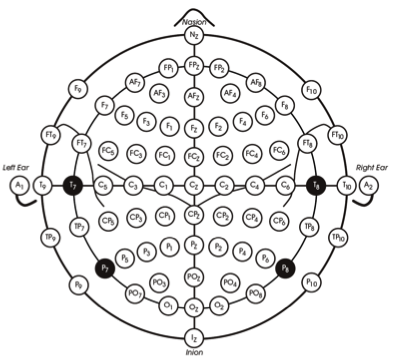
Hooking up, whether using 19, 24, 68 or 128 channels, as well as with a cap, or separate electrodes are also considerations. The electrodes you apply digitally amplify and filter the signal right at the site they’re placed; so careful placement is essential and based upon the International 10/20 System (128 site system pictured right). Impedance should be below 10 (preferably under 5) and at most 3 kOhms apart. BSI provides QEEG interpretations for your client’s recorded EEG.
Knowing what montage to use is another important consideration. For example, in bipolar montages, consecutive pairs of electrodes are linked by connecting the electrode input of one channel to input of a subsequent channel, so that adjacent channels have one electrode in common. The bipolar chains of electrodes may be connected going from front to back (longitudinal) or from left to right (transverse). Referential montages connect all of the active sensors to one reference (or possibly linked-ear reference).
There are many steps to creating a QEEG report. They are:
- Acquisition of the recording;
- De-artifacting the record;
- Viewing the artifacted record to determine if any transient behaviors persist;
- Reviewing FFTs, spectral displays and other digitally filtered images;
- Comparing the subject to a normative database;
- Isolating pathologies;
- Writing the report .
You can lean how to read a report HERE and view a sample one HERE.
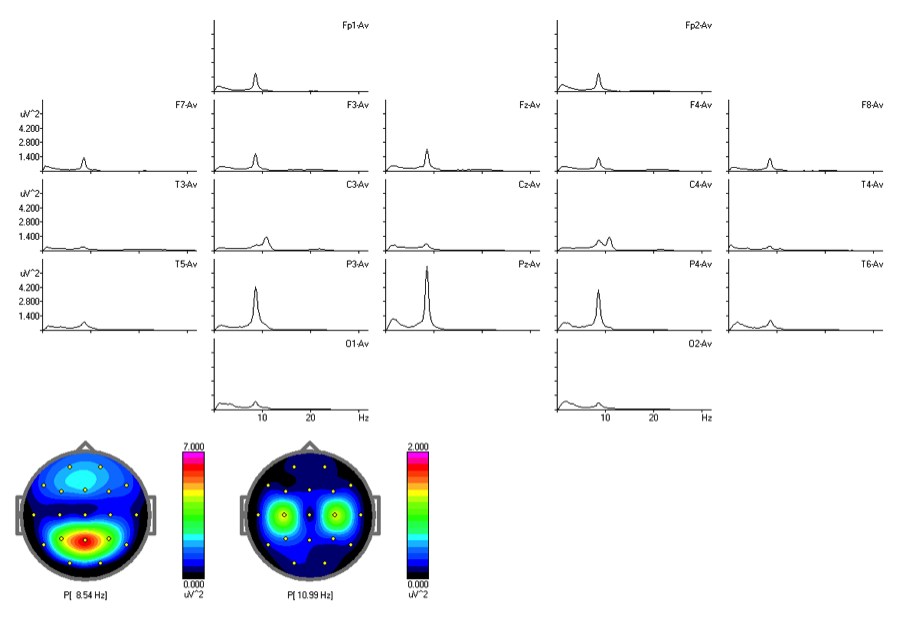
This is the spectral analysis created by passing the de-artifacted EEG file seen above through the Fourier analysis, with the spectral peaks being created at frequencies that have rhythmicity, such as the widespread alpha or the bi-central mu, with these values later compared to a normative database (as seen below).
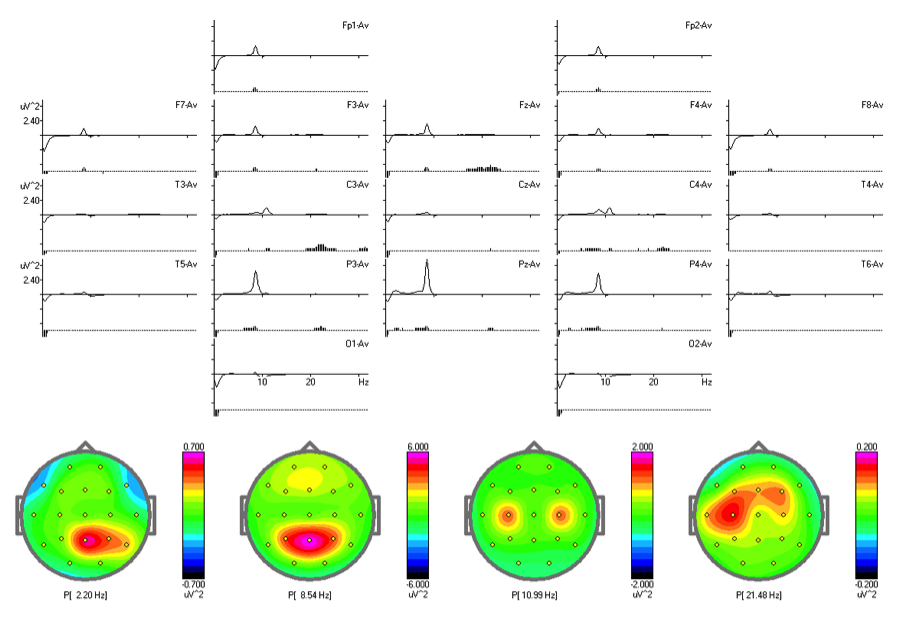
Client’s values are now compared to an age matched normative group, showing divergence in parietal slowing, excess eyes open alpha, bi-central mu, and fronto-central beta spindles. The small marks are significance markers, with the smaller marks signifying a probability of 0.05, and the middle sized marks being 0.01, and the larger marks associated with probability of over 0.001 (one chance in a thousand). These values are considered “Z-scores”, which show the divergence from normal.
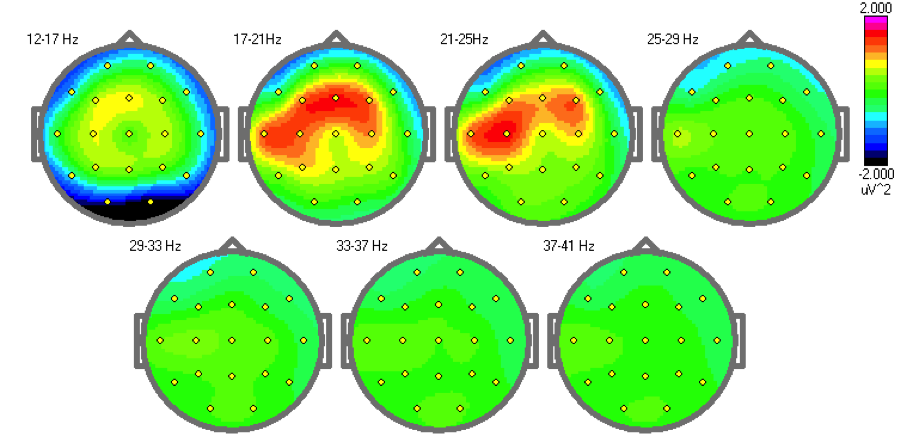
This mapping image shows the average coherences, and this shows the frontal alpha to be hypercoherent (red), and the central mu to be locked out of that hypercoherence as central hypocoherence (blue). The lack of faster alpha yields the lower than expected coherence measures.
Further Reading:
The Art of Artifacting – Hammond & Gunkelman
Electroencephalography: Basic Principles, Clinical Applications and Related Fields –Niedermeyer, Lopes Da Silva
EVENT RELATED POTENTIALS (ERPs)
The awakened functioning EEG is comprised of ongoing rhythms, like theta, alpha and beta, intermixed with the brain’s responses to specific stimuli. These specific responses to stimuli are very small, commonly less than 10 microvolts, and these miniscule voltages are embedded in the ongoing EEG which may be 50-150 microvolts commonly.
This makes these smaller signals almost impossible to detect, but if an averaging technique is used, these small signals can be added together so they get larger and can be seen, but the EEG when added together randomizes out, so the smaller specific response signals emerge from the background EEG.
When these averaged signals are then processed, the brain’s response to these sensory stimuli and the brain’s processing of the information can be evaluated.
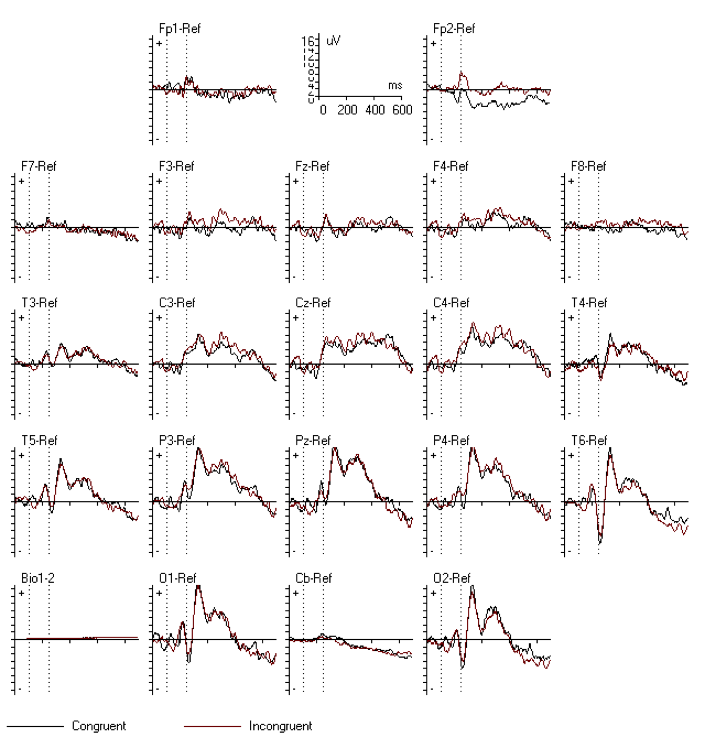
The Stroop test is one commonly used to evaluate latency of response. Others include N-Back, VCPT and classically these ERPs were merely crudely evaluated looking for gross changes in peak latencies. Modern analysis allows us much finer understanding of the rich information embedded in these signals. We use Independent Component Analysis (ICA) to break the ERP into the steps of processing the brain actually does, from perception, to evaluation of the task and even the response, and eventually even the comparison of the task response to the person’s model of how the response task should go.
This detail of analysis lets us compare how an individual’s response matches with those responses recorded from various clinical populations as well as compared with an age matched normative reference population.
The technical details of the ERP task and recording technique, the de-artifacting, signal processing, and clinical interpretations, once mastered are not excessively complex. Our workshops take these evaluations and recording tasks from being seen as “complex and difficult to comprehend” to being a routine part of any evaluation of brain function.
The depth of understanding needed to add these tools to your current clinical evaluations is imparted by our expert presenters.
LOW RESOLUTION ELECTROMAGNETIC TOMOGRAPHY (LORETA)
One shortcoming of the EEG is its spatial resolution. Another is that it records surface activity only. LORETA uses an inverse-solution to determine subcortical activity based upon the surface-recorded EEG. In essence, by estimating current density sources, it extrapolates the underlying activity, giving us a view of the more deep structures of the brain. Known as the “poor man’s fMRI,” due to it’s high correlation to fMRI studies, it is the first inexpensive, non-invasive assessment tool for practitioners of neuromodulatory approaches.
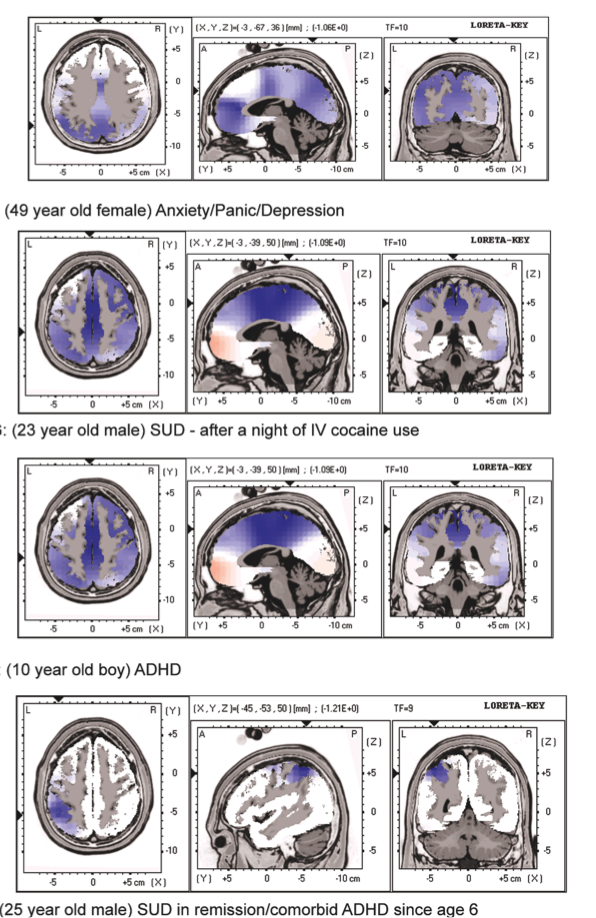
The maps* are examples of presentations of specific abnormalities.
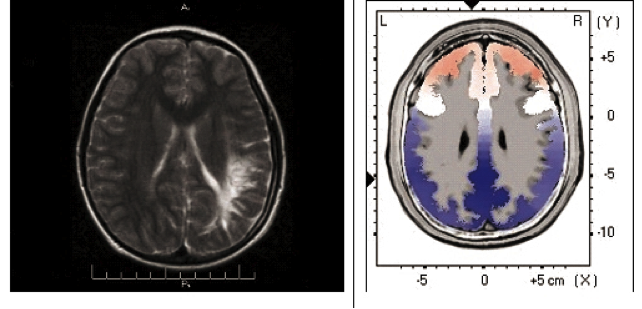
This is a LORETA Map* relative to a static MRI image.
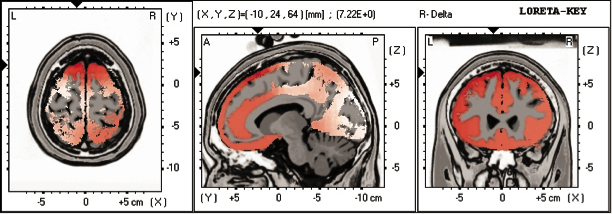
One must very carefully de-artifact for LORETA interpretations. In the sample above*, we see elevated delta activity, most notably in the frontal areas. This is likely eye-movement artifact because of its presence in delta only.
*All LORETA images are courtesy of Cannon, 2011 – reference below.
Further Reading:
Low Resolution Electromagnetic Brain Tomography (LORETA): Basic Concepts and Clinical Applications - Cannon
View BSI webinar recordings at your own pace. Inexpensive CEs. www.bsiwebinars.com
Neurofeedback Bibliography with abstracts. Last compiled Sept '14
TESTIMONIALS FROM REPORT USERS AND COURSE ATTENDEES:
"What an honor and privilege to be taught QEEG and LORETA by two of the most recognized and respected people in the field of EEG; Joel Lubar, PhD and Jay Gunkleman, QEEGD. BSI's small class size, coupled with hands on experience gave us real insight into the mechanics of using QEEG with clients. I now feel ready to go forward by incorporating these techniques into my practice."
- - - RI, LMFT, CNT Los Angeles, CA
"To date I’ve done over 300 Qs with BSI and compared to other services I’ve used, their reports are far superior and Jay is always available for discussion of each case. I have learned so much from Jay by discussing these cases with him."
- - - RJS, PhD, LCSW, BCB, BCN, Houston, TX
"I have found BSI's recorded webinars as an excellent resource to improve my neurfoeedback skill sets. BSI's webinars provide user-friendly access to leading applied and research experts within neurofeedback. In addition, my graduate students have purchased recorded webinar sessions; they reported this resource reduces the complexity of neurofeedback through cohesive and comprehensive trainings related to neurofeedback."
- - - JL, EdD, Assistant Professor Psychology, Illinois Institute of Technology
"Dr. Kerson is an excellent teacher and neurofeedback supervisor. She provides a warm and caring approach to learning the process as well as the content - even when it is difficult to understand. She has a great sense of humor, and makes the learning interactive and fun. More importantly, she really cares about her students and takes the time to be sure everyone is succeeding."
- - - SS, PhD Associate Professor UNLV